Fig. 2
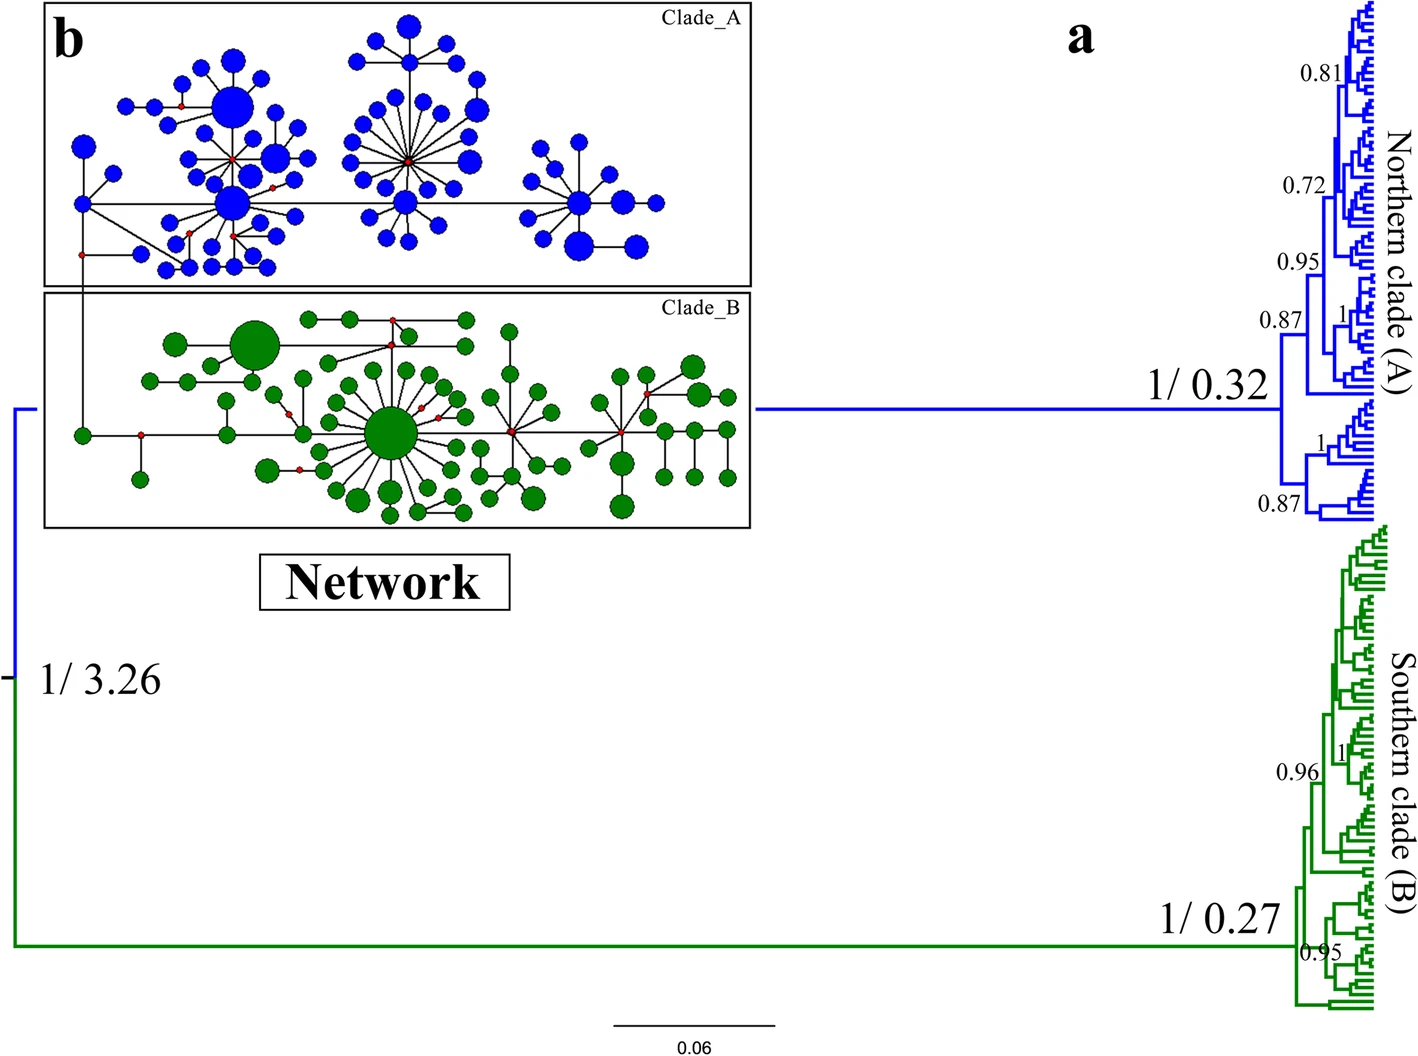
Phylogenetic relationships based on the haplotypes of concatenated mitochondrial genes (COI + Cytb+CR). a Bayesian trees. b Median-joining networks. The coloured bars indicate the geographical clades: blue denotes the northern clade (a) and green denotes the southern clade (b). The number on the left of a slash is the posterior probability and that on the right is divergence time. Posterior probabilities > 0.70 are labelled at each node. Red dots refer to missing steps intermediate between the observed haplotypes